QuiXoT
| QuiXoT |
|---|
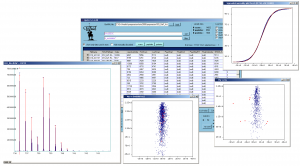
 Screenshot of QuiXoT, depicting different spectra and graphs used. |
| Last release: v.1.4.00 |
| Release date: 20th Aug 2013 |
| Download link: [[{{{link}}}]] Source code: QuiXoT at GitHub |
| Licence: Please read Licencing |
| Requirements |
|
QuiXoT is an open source software created for the quantitation and statistical analysis of quantitative proteomics experiments. It has been developed at the Cardiovascular Proteomics Laboratory of Prof Jesús Vázquez, at the Centro Nacional de Investigaciones Cardiovasculares (CNIC), Madrid, Spain.
It has been developed in Visual C#, hence users must install the .NET Framework 2.0 or higher (not necessary for Windows 7 users), which can be downloaded from this link.
Using QuiXoT
- See also the article: DataGrid information in QuiXoT.
QuiXoT makes use of a QuiXML files, which is an ad hoc XML format created to manage the three levels of information treated: identification, quantitation and statistical information. To check a list of the different fields used in QuiXML files (i.e., the columns appearing in the main window of QuiXoT), you can check the article DataGrid information in QuiXoT.
If you just want to see an existing QuiXoT analysis, you only need the corresponding QuiXML file. Just drag and drop that file on the main form, and select the quantitation method used, which will depend on the SIL method used (such as 18O, SILAC, etc) and the spectrometre used (sich as high or low resolution).


